A friend likes sending me puzzles at midnight. It’s called the Emperor’s Proposition and here it is (slightly modified but idea just the same),
You are in prison. The guard can set you free if you win a game. You will be given 100 black marbles, 100 white marbles and 2 bowls. You are allowed to place the marbles in any of the bowls, and you are not allowed to leave any marble outside. Once you are finished, the guard will choose a bowl at random and take out a single marble from it at random. If the marble is black, you win, if its white, you lose. What is the best way of distributing the marbles so you can win?
There are many pages with the answer and explanation of the conditional probabilities. Spoiler alert: answer coming up in next sentence. Best choice is to put a single black marble in one bowl and all others in the other. Here is how the probability varies as the composition of marbles is varied. We consider the composition in one of the bowls only because we have just 2 independent variables in this problem.
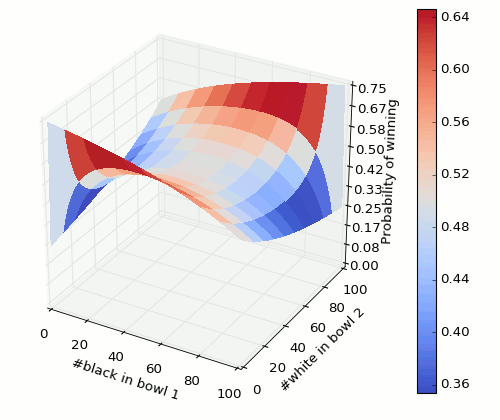
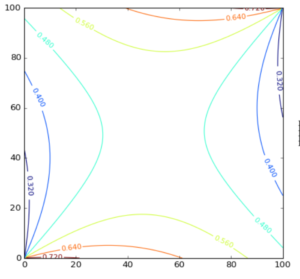
It’s quite a slippery surface 🙂 And contour graph,
Python code,
%matplotlib notebook
from mpl_toolkits.mplot3d import Axes3D
import matplotlib.pyplot as plt
from matplotlib import cm
from matplotlib.ticker import LinearLocator, FormatStrFormatter
import numpy as np

fig = plt.figure()
ax = fig.gca(projection='3d')

def div(a, b):
 return a/np.maximum(b, 1)

# make data
X = np.arange(0.0, 101.0, 1.0)
Y = np.arange(0.0, 101.0, 1.0)
X, Y = np.meshgrid(X, Y)
Z = 0.5*(div(X, (X+Y)) + div((100-X), (200-(X+Y))))

# surface plot
surf = ax.plot_surface(X, Y, Z, cmap=cm.coolwarm,
 linewidth=0, antialiased=False)
ax.set_zlim(0.0, 0.75)
ax.set_zlim3d(0.0, 0.75)
ax.zaxis.set_major_locator(LinearLocator(10))
ax.zaxis.set_major_formatter(FormatStrFormatter('%.02f'))
ax.set_xlabel('#black in bowl 1')
ax.set_ylabel('#white in bowl 2')
ax.set_zlabel('Probability of winning')
fig.colorbar(surf)
plt.show()

# countour plot
plt.figure()
CS = plt.contour(X, Y, Z)
plt.clabel(CS, inline=1, fontsize=10)
CB = plt.colorbar(CS, shrink=0.1, extend='both')
plt.show()